What is the Dashboard?
The Dashboard provides headline information about what's going on in your business.
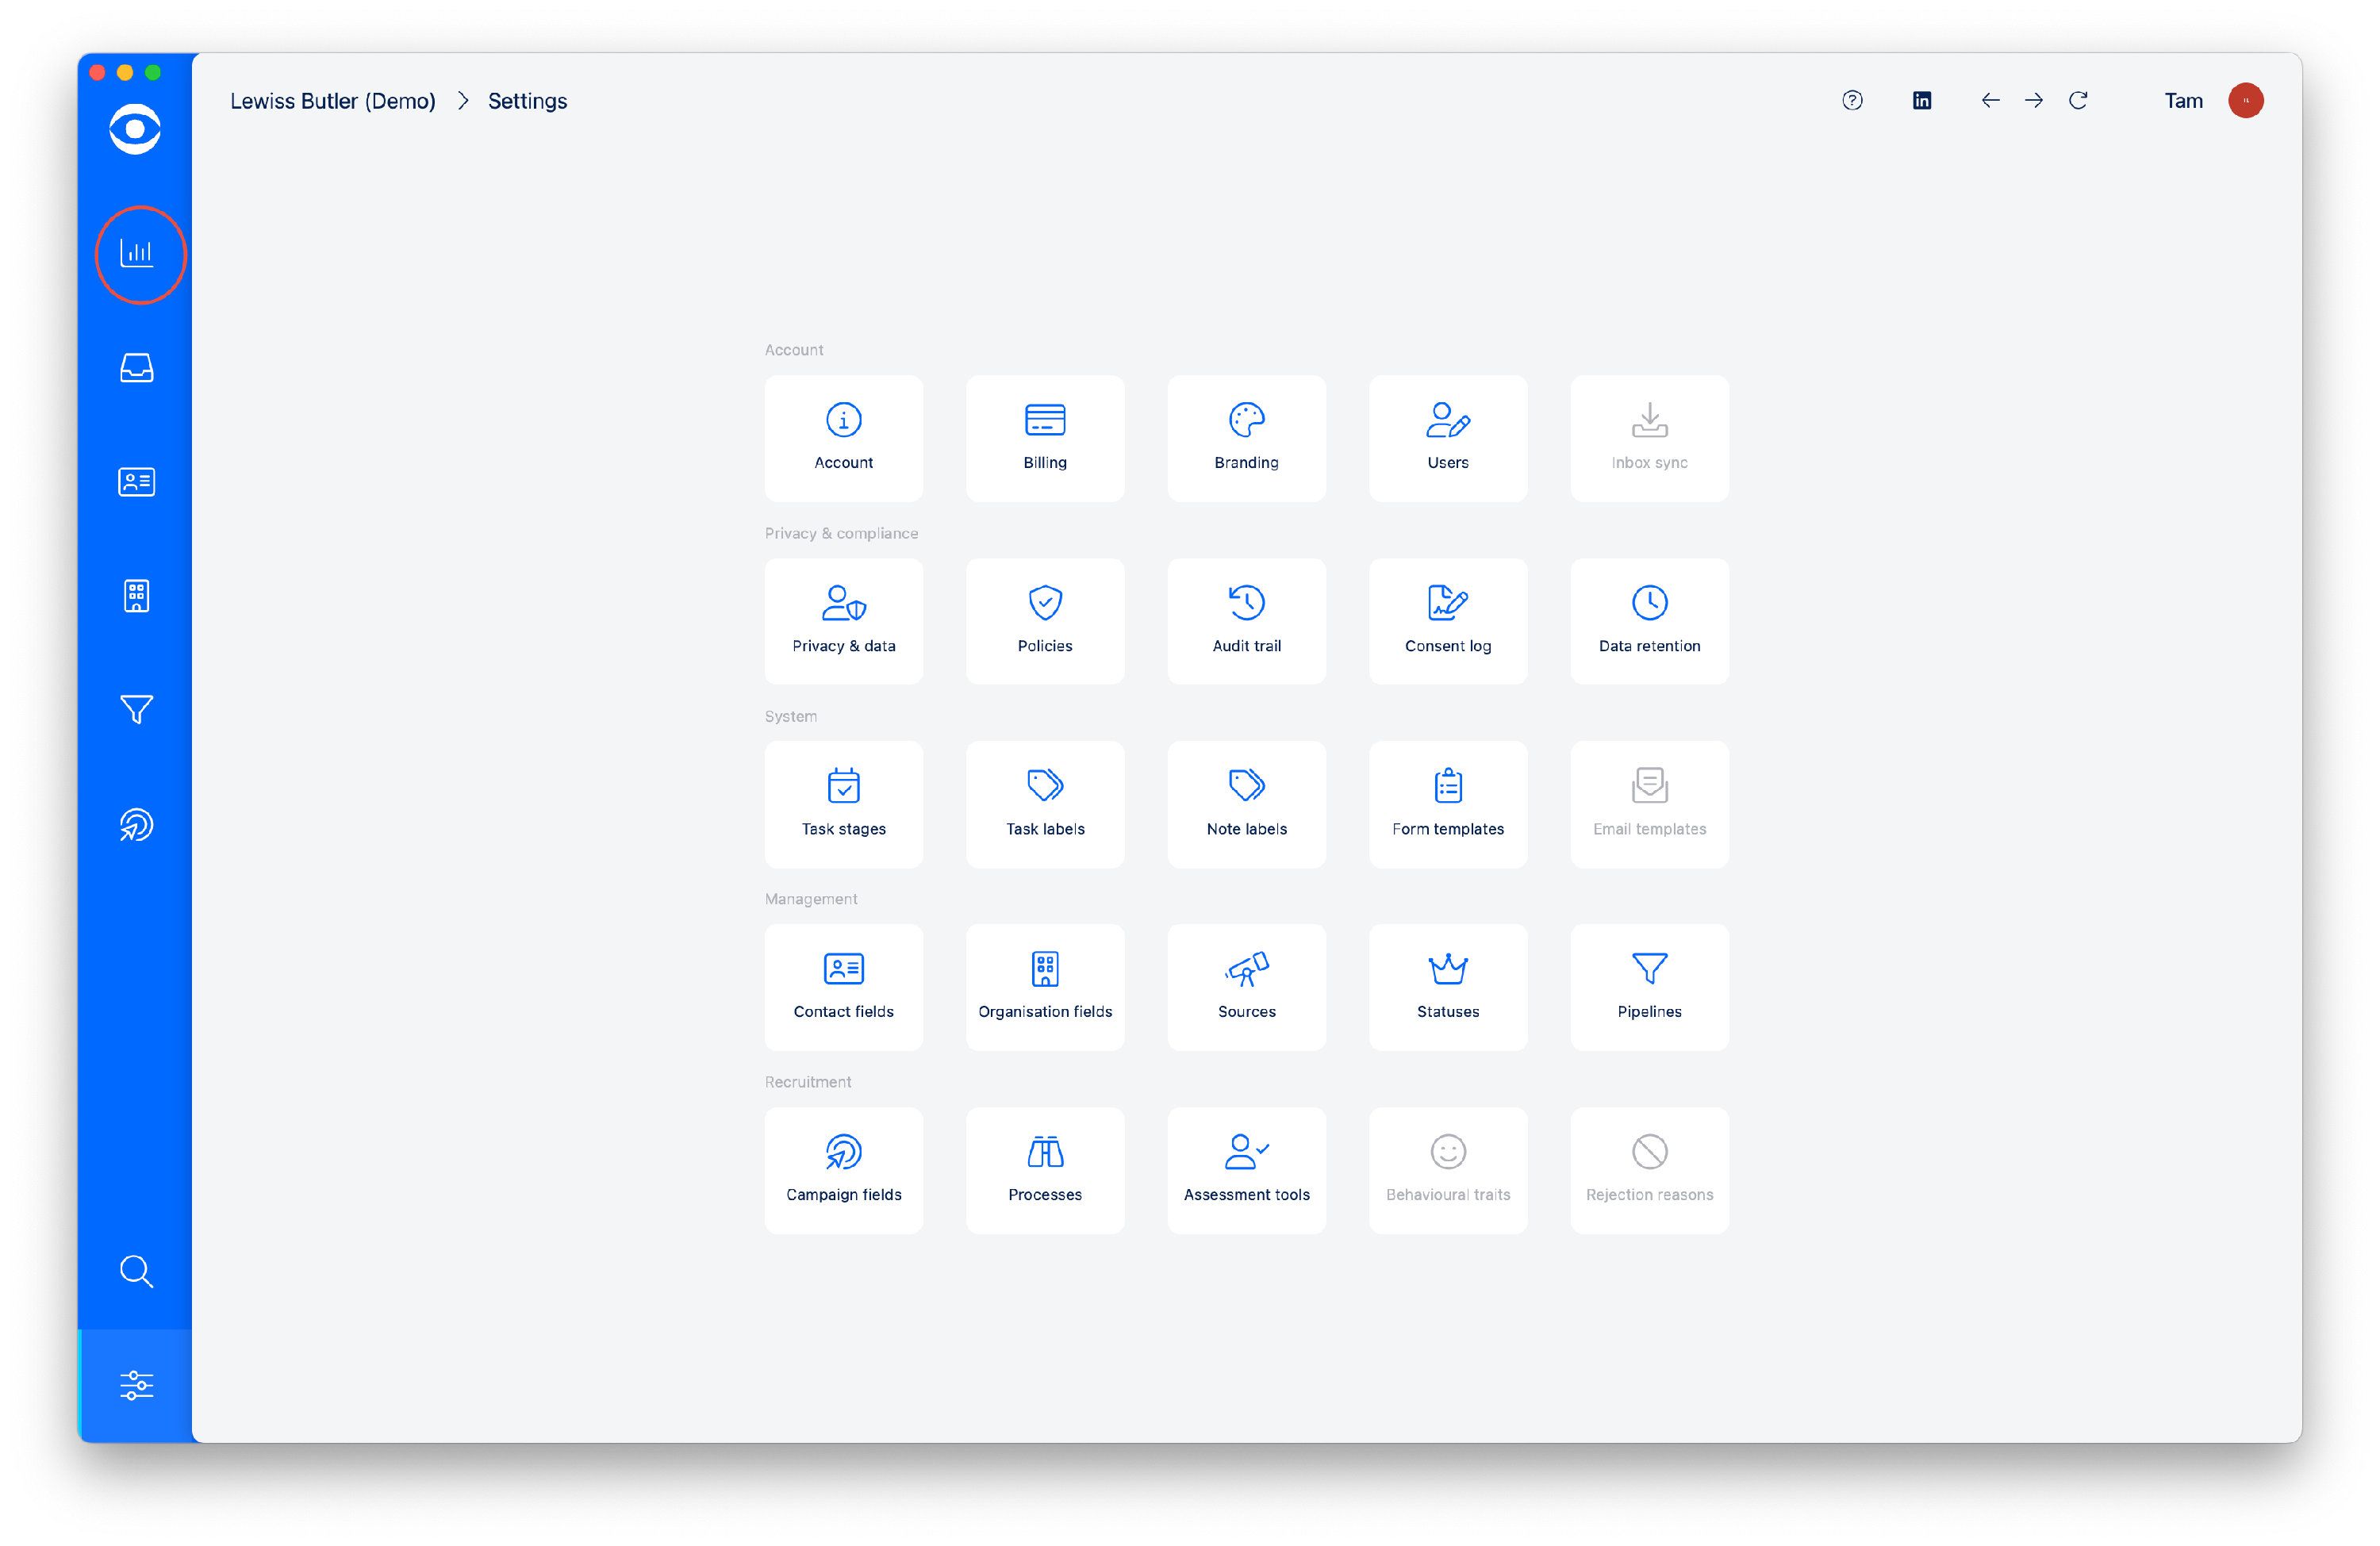
Access the Dashboard by clicking on the top icon in the lefthand toolbar.
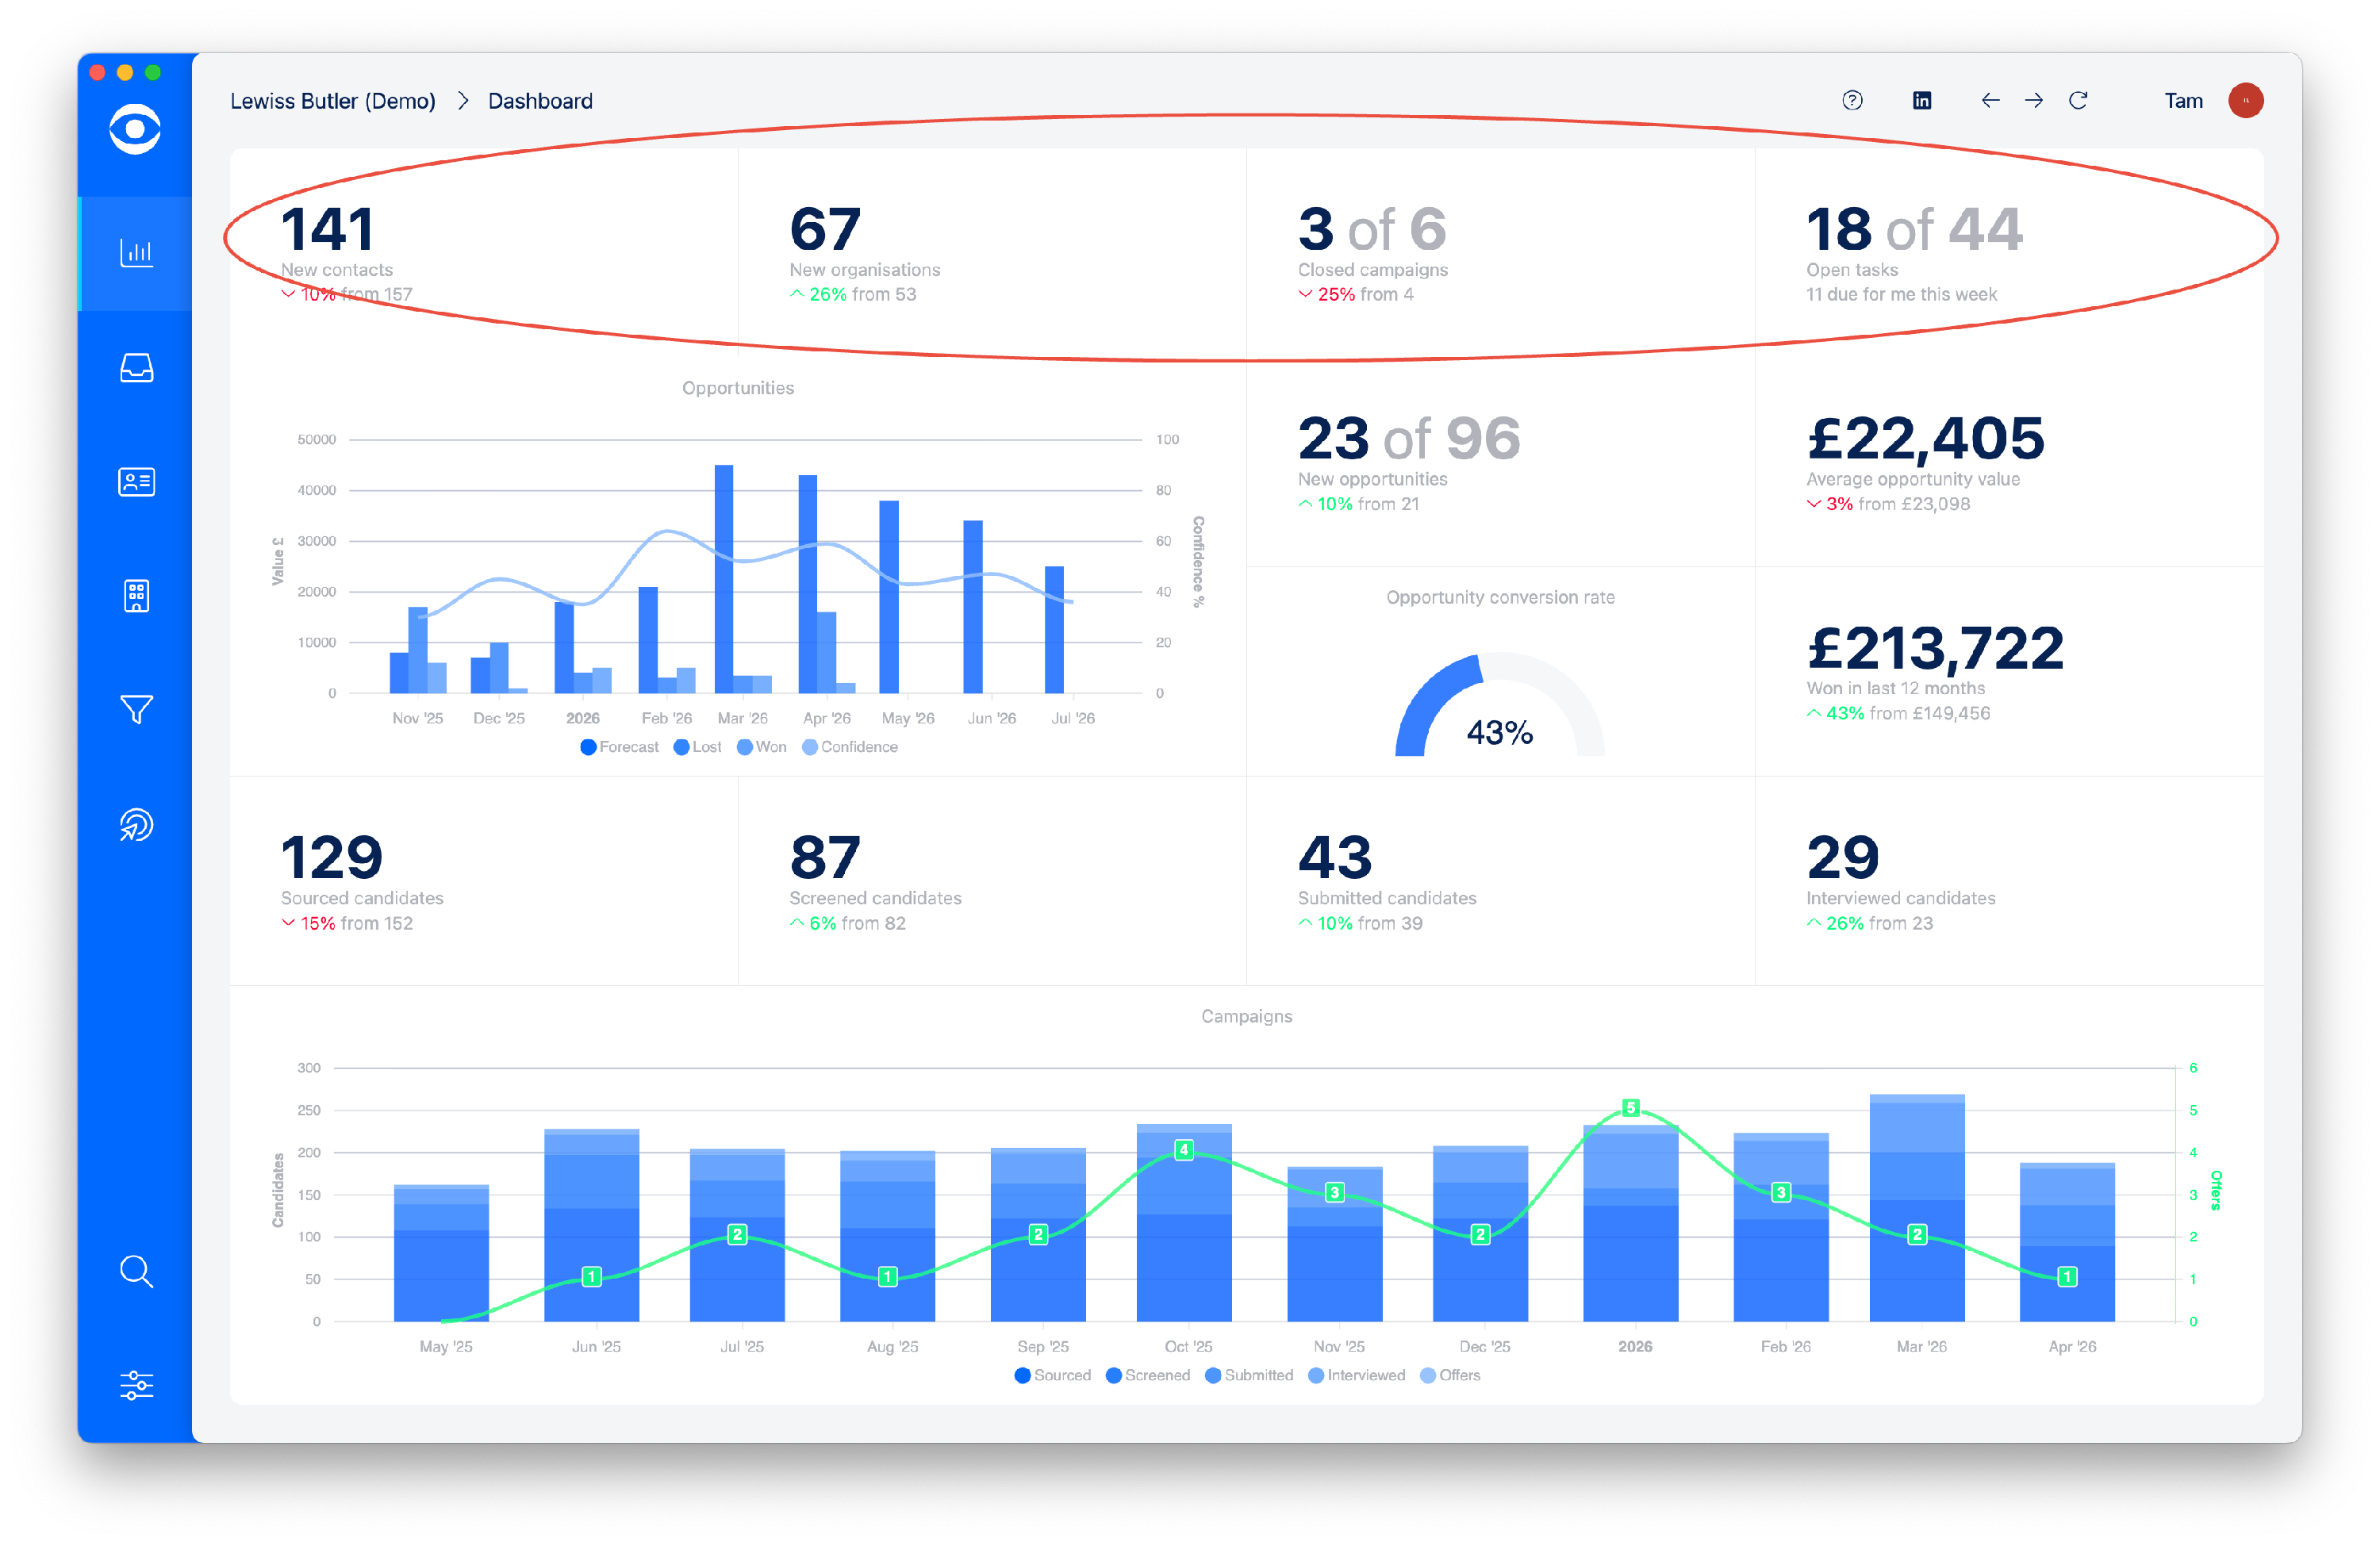
The Dashboard is divided into four columns and four rows.
The quoted figures are based on the previous four week period and update on a rolling basis.
The top row is headline information showing:
New Contacts - total and variance against the previous period
New organisations - total and variance against the previous period
Closed campaigns - number closed in last period and variance
Tasks - number of open tasks and specific number for you this week
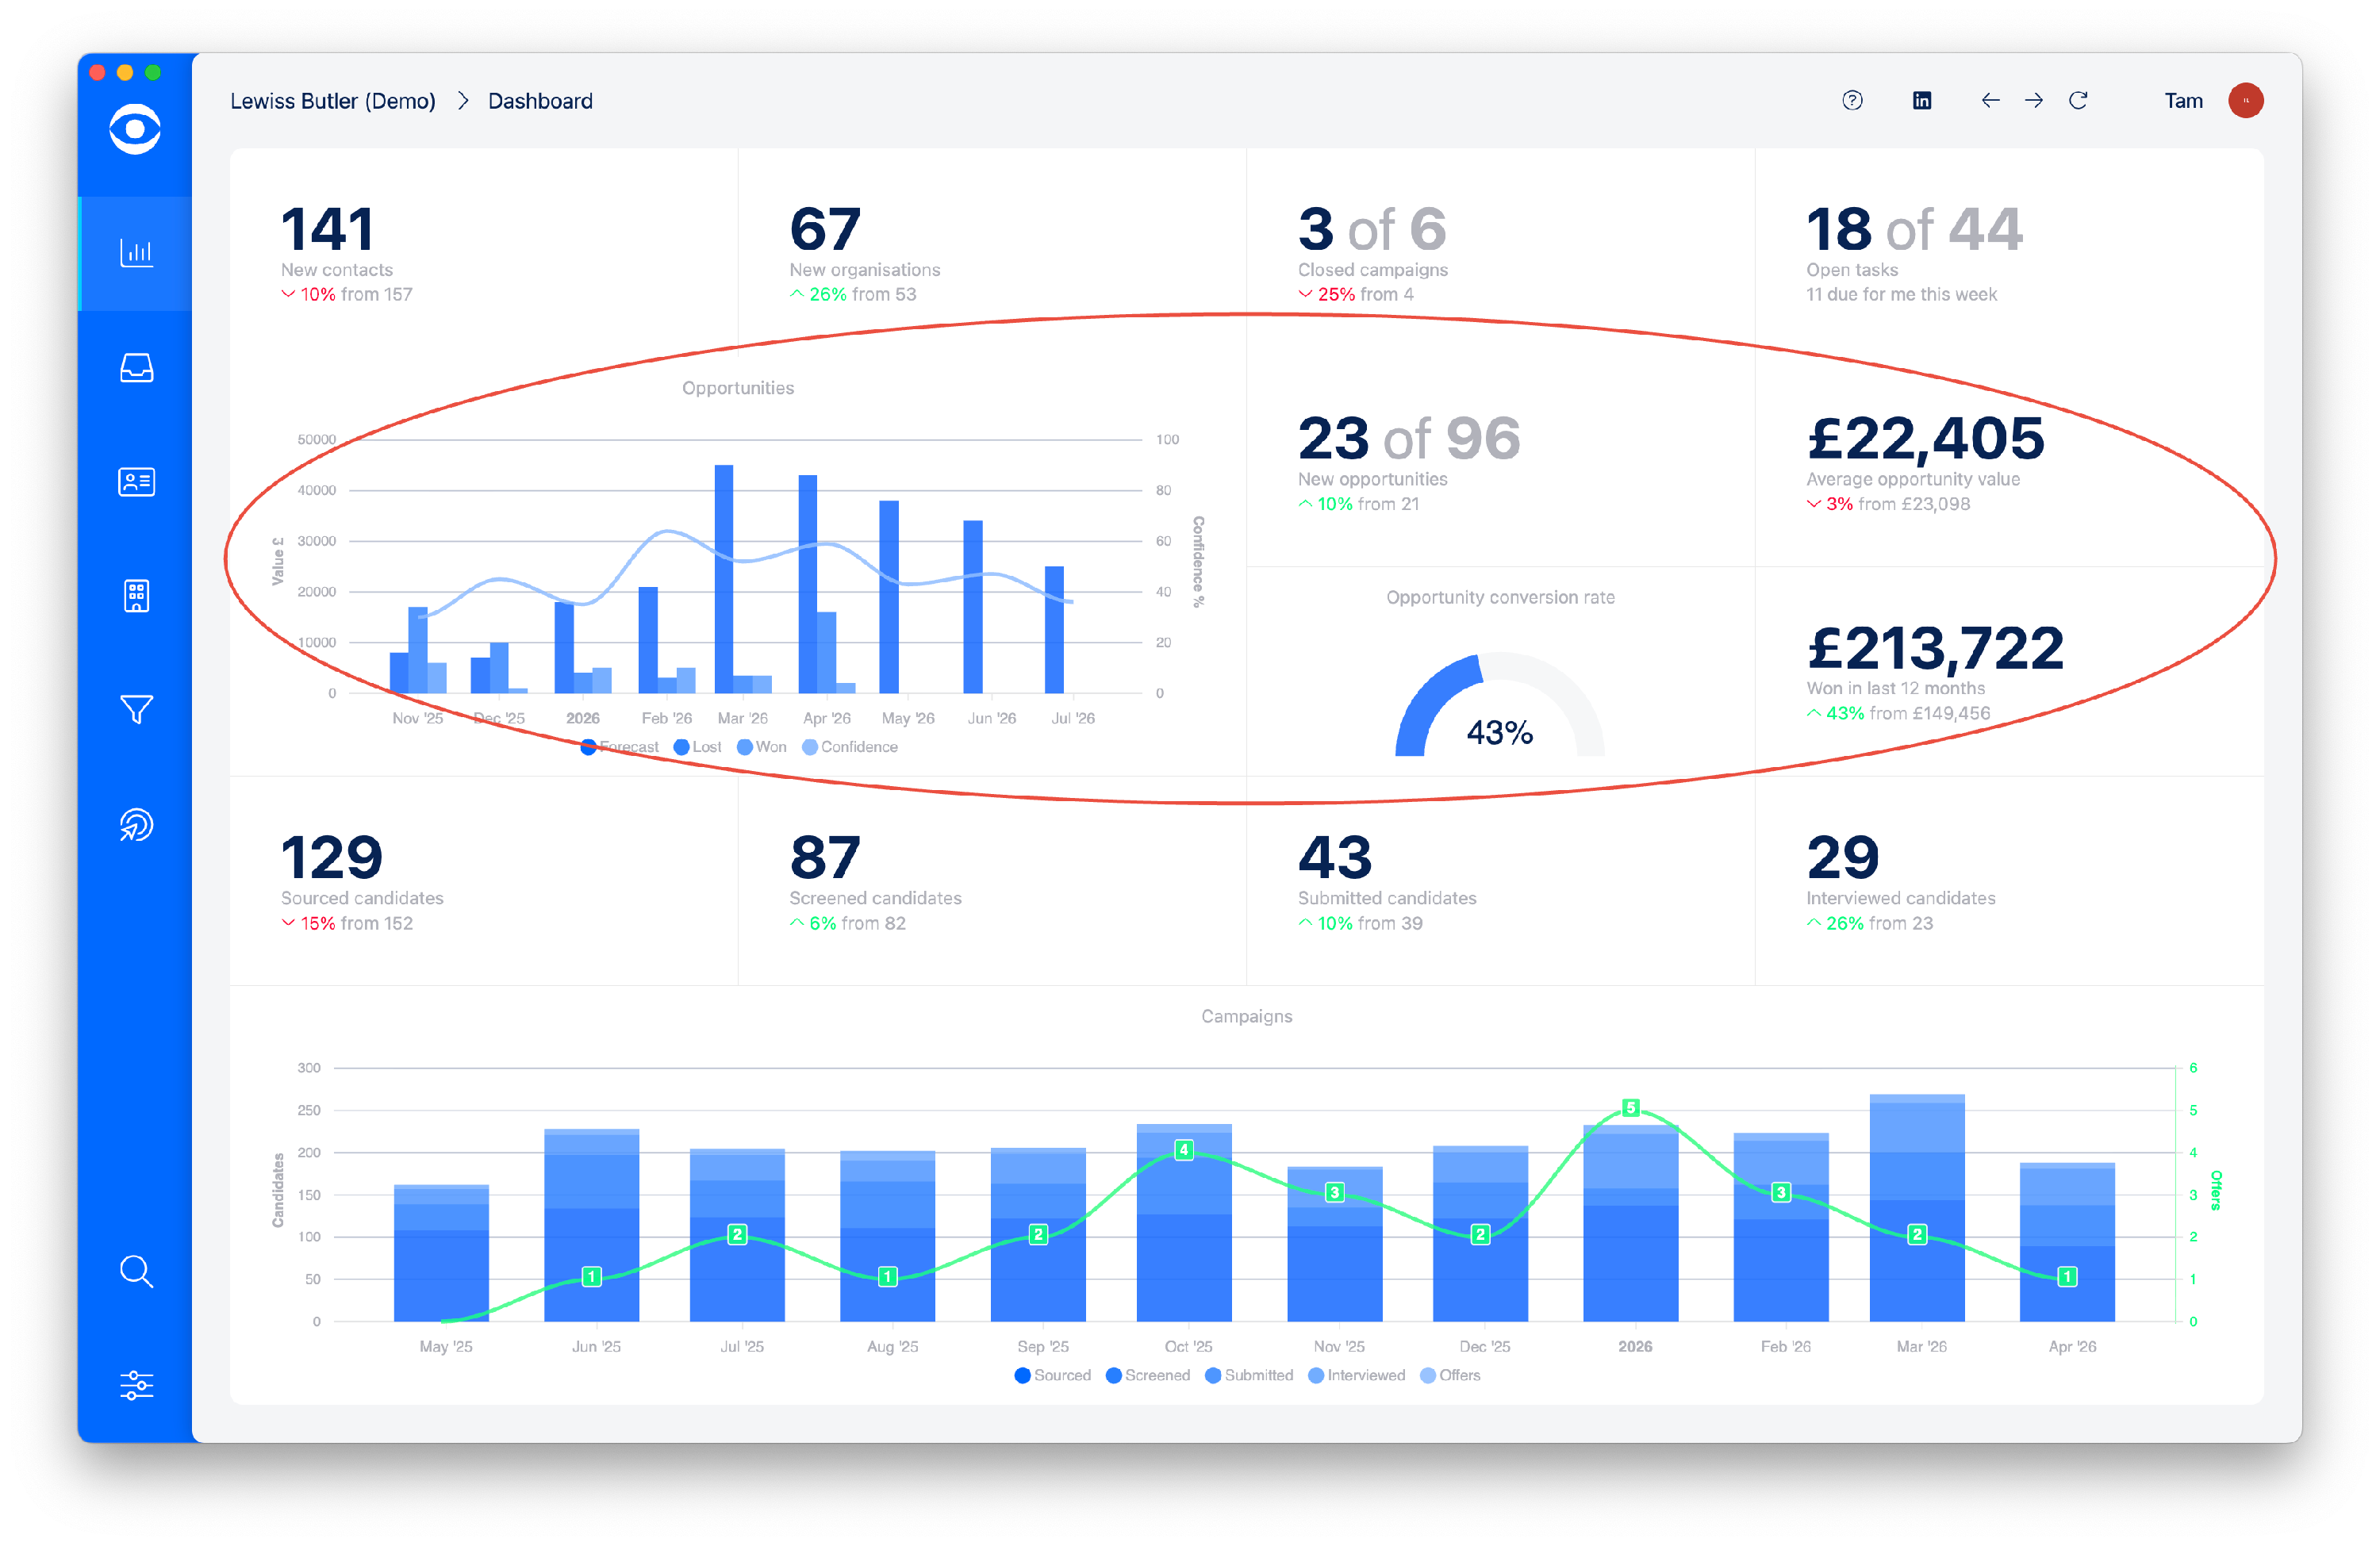
The second and third rows show business development:
Graph - Forecast, won, lost and confidence
New opportunities - total and variance
Average opportunity value - total and variance
Conversion rate
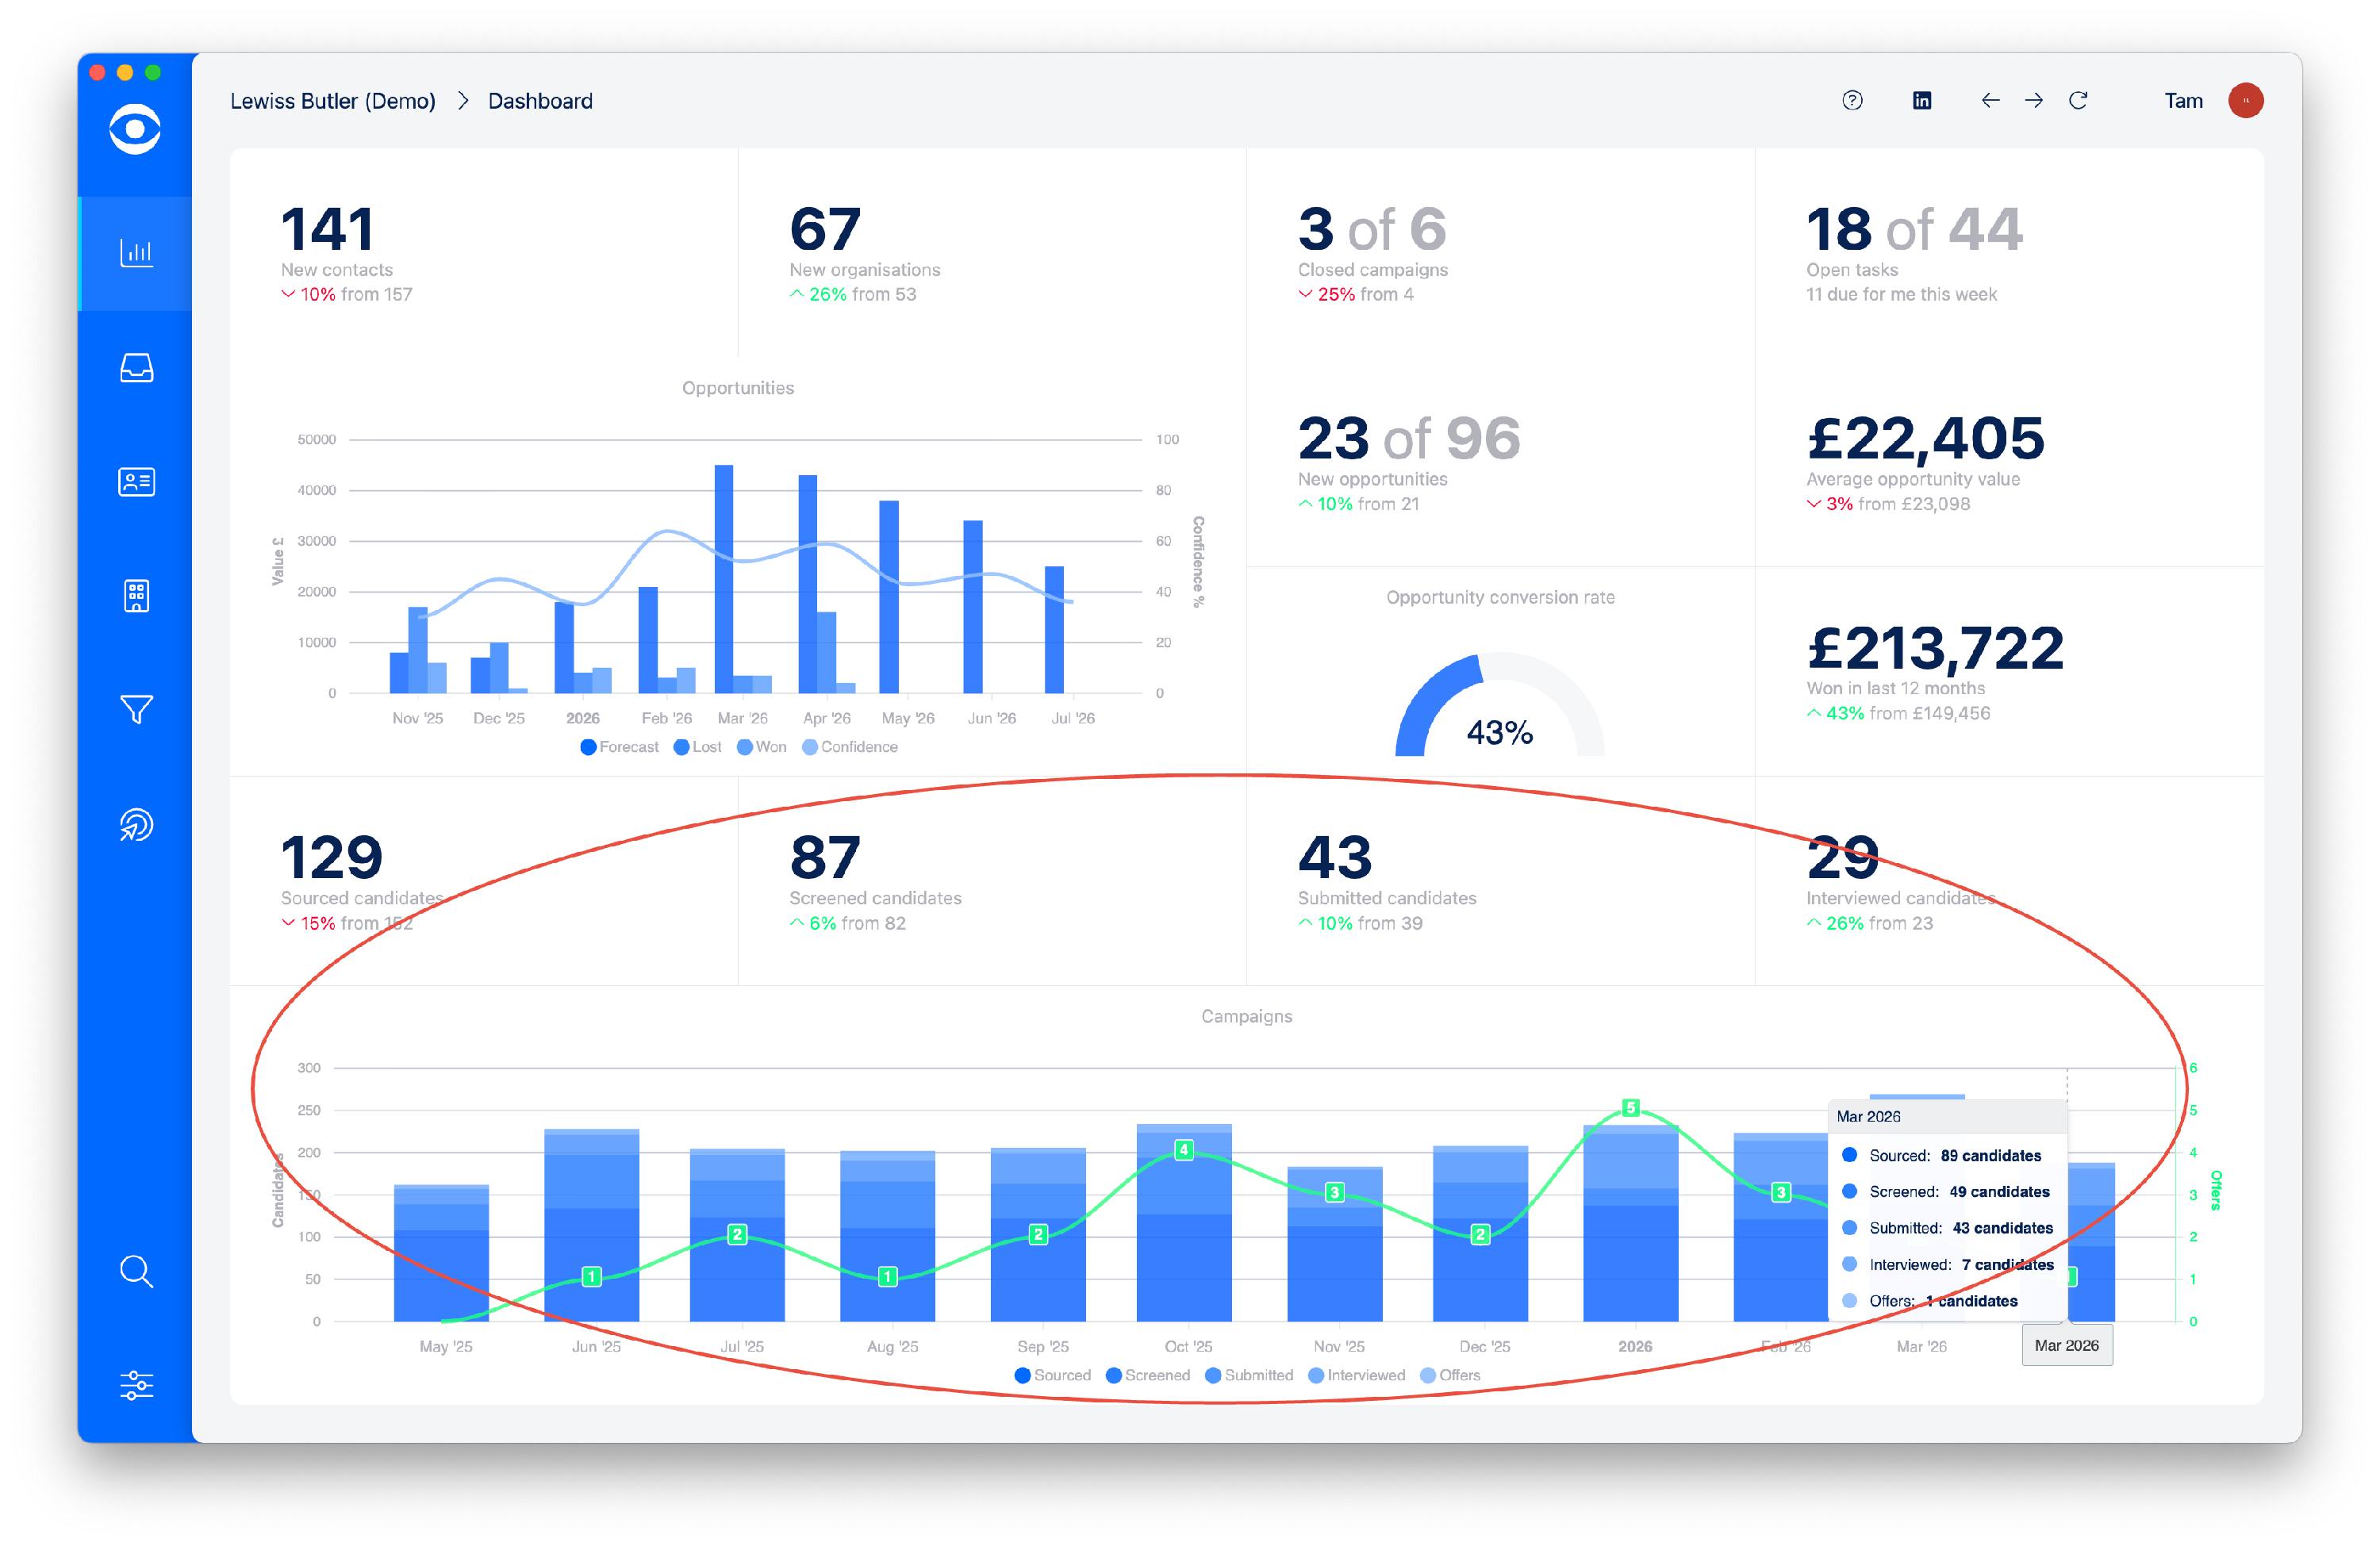
The bottom two rows show campaign delivery:
Sourced candidates - total and variance
Screened candidates - total and variance
Submitted candidates - total and variance
Interviewed candidates - total and variance
Graph - shows a summary by month of the campaign delivery information